


Census Tract 403.03, Clayton County, Georgia
About
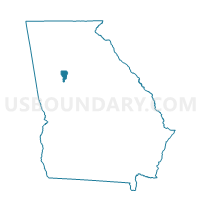
Outline

Summary
| Unique Area Identifier | 450348 |
| Name | Census Tract 403.03 |
| County | Clayton County |
| State | Georgia |
| Area (square miles) | 2.31 |
| Land Area (square miles) | 2.30 |
| Water Area (square miles) | 0.01 |
| % of Land Area | 99.57 |
| % of Water Area | 0.43 |
| Latitude of the Internal Point | 33.63391340 |
| Longtitude of the Internal Point | -84.35158210 |
| Total Population | 6,953 |
| Total Housing Units | 2,681 |
| Total Households | 2,224 |
| Median Age | 30.5 |
Maps

Graphs
Select a template below for downloading or customizing gragh for Census Tract 403.03, Clayton County, Georgia


Neighbors
Neighoring Census Tract (by Name) Neighboring Census Tract on the Map
- Census Tract 234.23, DeKalb County, GA
- Census Tract 403.02, Clayton County, GA
- Census Tract 403.08, Clayton County, GA
- Census Tract 404.07, Clayton County, GA
- Census Tract 404.10, Clayton County, GA
- Census Tract 72, Fulton County, GA
Top 10 Neighboring County Subdivision (by Population) Neighboring County Subdivision on the Map
- Atlanta CCD, Fulton County, GA (531,648)
- Atlanta-Decatur CCD, DeKalb County, GA (355,979)
- Forest Park-Morrow CCD, Clayton County, GA (91,196)
Top 10 Neighboring Place (by Population) Neighboring Place on the Map
- Atlanta city, GA (420,003)
- Forest Park city, GA (18,468)
- Conley CDP, GA (6,228)
- Lake City city, GA (2,612)
Top 10 Neighboring Unified School District (by Population) Neighboring Unified School District on the Map
- DeKalb County School District, GA (644,266)
- Atlanta City School District, GA (420,003)
- Clayton County School District, GA (259,424)
Top 10 Neighboring State Legislative District Lower Chamber (by Population) Neighboring State Legislative District Lower Chamber on the Map
- State House District 76, GA (57,823)
- State House District 75, GA (42,907)
- State House District 60, GA (39,431)
- State House District 62, GA (37,690)
Top 10 Neighboring State Legislative District Upper Chamber (by Population) Neighboring State Legislative District Upper Chamber on the Map
- State Senate District 10, GA (173,450)
- State Senate District 44, GA (170,216)
- State Senate District 36, GA (145,158)
Top 10 Neighboring 111th Congressional District (by Population) Neighboring 111th Congressional District on the Map
Top 10 Neighboring 5-Digit ZIP Code Tabulation Area (by Population) Neighboring 5-Digit ZIP Code Tabulation Area on the Map
Explore Neighbors on the MapData
Demographic, Population, Households, and Housing Units
** Data sources from census 2010 **
Show Data on Map
Download Full List as CSV
Download Quick Sheet as CSV
| Subject | This Area | Clayton County | Georgia | National |
|---|---|---|---|---|
| POPULATION | ||||
| Total Population Map | 6,953 | 259,424 | 9,687,653 | 308,745,538 |
| POPULATION, HISPANIC OR LATINO ORIGIN | ||||
| Not Hispanic or Latino Map | 5,065 | 223,977 | 8,833,964 | 258,267,944 |
| Hispanic or Latino Map | 1,888 | 35,447 | 853,689 | 50,477,594 |
| POPULATION, RACE | ||||
| White alone Map | 1,650 | 48,960 | 5,787,440 | 223,553,265 |
| Black or African American alone Map | 3,616 | 171,480 | 2,950,435 | 38,929,319 |
| American Indian and Alaska Native alone Map | 19 | 965 | 32,151 | 2,932,248 |
| Asian alone Map | 346 | 12,937 | 314,467 | 14,674,252 |
| Native Hawaiian and Other Pacific Islander alone Map | 2 | 139 | 6,799 | 540,013 |
| Some Other Race alone Map | 1,169 | 18,376 | 388,872 | 19,107,368 |
| Two or More Races Map | 151 | 6,567 | 207,489 | 9,009,073 |
| POPULATION, SEX | ||||
| Male Map | 3,451 | 124,232 | 4,729,171 | 151,781,326 |
| Female Map | 3,502 | 135,192 | 4,958,482 | 156,964,212 |
| POPULATION, AGE (18 YEARS) | ||||
| 18 years and over Map | 4,789 | 184,445 | 7,196,101 | 234,564,071 |
| Under 18 years | 2,164 | 74,979 | 2,491,552 | 74,181,467 |
| POPULATION, AGE | ||||
| Under 5 years | 677 | 21,939 | 686,785 | 20,201,362 |
| 5 to 9 years | 629 | 20,779 | 695,161 | 20,348,657 |
| 10 to 14 years | 524 | 20,026 | 689,684 | 20,677,194 |
| 15 to 17 years | 334 | 12,235 | 419,922 | 12,954,254 |
| 18 and 19 years | 213 | 7,998 | 290,077 | 9,086,089 |
| 20 years | 97 | 4,004 | 143,471 | 4,519,129 |
| 21 years | 90 | 3,933 | 137,251 | 4,354,294 |
| 22 to 24 years | 303 | 11,832 | 399,358 | 12,712,576 |
| 25 to 29 years | 544 | 20,166 | 673,935 | 21,101,849 |
| 30 to 34 years | 547 | 19,730 | 661,625 | 19,962,099 |
| 35 to 39 years | 513 | 20,431 | 698,059 | 20,179,642 |
| 40 to 44 years | 454 | 19,478 | 699,481 | 20,890,964 |
| 45 to 49 years | 520 | 18,888 | 722,661 | 22,708,591 |
| 50 to 54 years | 430 | 16,825 | 668,591 | 22,298,125 |
| 55 to 59 years | 318 | 13,529 | 573,551 | 19,664,805 |
| 60 and 61 years | 109 | 4,697 | 209,870 | 7,113,727 |
| 62 to 64 years | 150 | 5,698 | 286,136 | 9,704,197 |
| 65 and 66 years | 71 | 3,007 | 154,645 | 5,319,902 |
| 67 to 69 years | 104 | 3,634 | 201,362 | 7,115,361 |
| 70 to 74 years | 120 | 4,235 | 250,422 | 9,278,166 |
| 75 to 79 years | 101 | 3,043 | 182,735 | 7,317,795 |
| 80 to 84 years | 62 | 1,878 | 129,048 | 5,743,327 |
| 85 years and over | 43 | 1,439 | 113,823 | 5,493,433 |
| MEDIAN AGE BY SEX | ||||
| Both sexes Map | 30.50 | 31.60 | 35.30 | 37.20 |
| Male Map | 29.40 | 30.10 | 34.10 | 35.80 |
| Female Map | 32.10 | 33.10 | 36.50 | 38.50 |
| HOUSEHOLDS | ||||
| Total Households Map | 2,224 | 90,633 | 3,585,584 | 116,716,292 |
| HOUSEHOLDS, HOUSEHOLD TYPE | ||||
| Family households: Map | 1,581 | 62,389 | 2,457,810 | 77,538,296 |
| Husband-wife family Map | 769 | 33,033 | 1,714,573 | 56,510,377 |
| Other family: Map | 812 | 29,356 | 743,237 | 21,027,919 |
| Male householder, no wife present Map | 204 | 6,398 | 175,090 | 5,777,570 |
| Female householder, no husband present Map | 608 | 22,958 | 568,147 | 15,250,349 |
| Nonfamily households: Map | 643 | 28,244 | 1,127,774 | 39,177,996 |
| Householder living alone Map | 496 | 23,032 | 909,474 | 31,204,909 |
| Householder not living alone Map | 147 | 5,212 | 218,300 | 7,973,087 |
| HOUSEHOLDS, HISPANIC OR LATINO ORIGIN OF HOUSEHOLDER | ||||
| Not Hispanic or Latino householder: Map | 1,826 | 82,429 | 3,377,850 | 103,254,926 |
| Hispanic or Latino householder: Map | 398 | 8,204 | 207,734 | 13,461,366 |
| HOUSEHOLDS, RACE OF HOUSEHOLDER | ||||
| Householder who is White alone | 601 | 19,239 | 2,270,546 | 89,754,352 |
| Householder who is Black or African American alone | 1,253 | 61,830 | 1,064,711 | 14,129,983 |
| Householder who is American Indian and Alaska Native alone | 4 | 305 | 10,909 | 939,707 |
| Householder who is Asian alone | 93 | 3,415 | 95,786 | 4,632,164 |
| Householder who is Native Hawaiian and Other Pacific Islander alone | 0 | 39 | 1,961 | 143,932 |
| Householder who is Some Other Race alone | 243 | 4,161 | 91,232 | 4,916,427 |
| Householder who is Two or More Races | 30 | 1,644 | 50,439 | 2,199,727 |
| HOUSEHOLDS, HOUSEHOLD TYPE BY HOUSEHOLD SIZE | ||||
| Family households: Map | 1,581 | 62,389 | 2,457,810 | 77,538,296 |
| 2-person household Map | 465 | 20,084 | 957,729 | 31,882,616 |
| 3-person household Map | 347 | 15,732 | 592,787 | 17,765,829 |
| 4-person household Map | 297 | 12,589 | 503,595 | 15,214,075 |
| 5-person household Map | 228 | 7,379 | 240,456 | 7,411,997 |
| 6-person household Map | 119 | 3,599 | 96,811 | 3,026,278 |
| 7-or-more-person household Map | 125 | 3,006 | 66,432 | 2,237,501 |
| Nonfamily households: Map | 643 | 28,244 | 1,127,774 | 39,177,996 |
| 1-person household Map | 496 | 23,032 | 909,474 | 31,204,909 |
| 2-person household Map | 97 | 4,151 | 172,409 | 6,360,012 |
| 3-person household Map | 27 | 612 | 28,107 | 992,156 |
| 4-person household Map | 16 | 249 | 11,923 | 411,171 |
| 5-person household Map | 4 | 113 | 3,619 | 126,634 |
| 6-person household Map | 1 | 50 | 1,309 | 48,421 |
| 7-or-more-person household Map | 2 | 37 | 933 | 34,693 |
| HOUSING UNITS | ||||
| Total Housing Units Map | 2,681 | 104,705 | 4,088,801 | 131,704,730 |
| HOUSING UNITS, OCCUPANCY STATUS | ||||
| Occupied Map | 2,224 | 90,633 | 3,585,584 | 116,716,292 |
| Vacant Map | 457 | 14,072 | 503,217 | 14,988,438 |
| HOUSING UNITS, OCCUPIED, TENURE | ||||
| Owned with a mortgage or a loan Map | 877 | 43,688 | 1,751,631 | 52,979,430 |
| Owned free and clear Map | 284 | 8,042 | 602,771 | 23,006,644 |
| Renter occupied Map | 1,063 | 38,903 | 1,231,182 | 40,730,218 |
| HOUSING UNITS, VACANT, VACANCY STATUS | ||||
| For rent Map | 220 | 7,868 | 174,416 | 4,137,567 |
| Rented, not occupied Map | 27 | 285 | 6,792 | 206,825 |
| For sale only Map | 55 | 2,199 | 83,852 | 1,896,796 |
| Sold, not occupied Map | 3 | 213 | 13,118 | 421,032 |
| For seasonal, recreational, or occasional use Map | 6 | 290 | 81,511 | 4,649,298 |
| For migrant workers Map | 0 | 0 | 854 | 24,161 |
| Other vacant Map | 146 | 3,217 | 142,674 | 3,652,759 |
| HOUSING UNITS, OCCUPIED, AVERAGE HOUSEHOLD SIZE BY TENURE | ||||
| Total: Map | 3.10 | 2.82 | 2.63 | 2.58 |
| Owner occupied Map | 2.97 | 2.84 | 2.67 | 2.65 |
| Renter occupied Map | 3.23 | 2.79 | 2.56 | 2.44 |
| HOUSING UNITS, OCCUPIED, TENURE BY RACE OF HOUSEHOLDER | ||||
| Owner occupied: Map | 1,161 | 51,730 | 2,354,402 | 75,986,074 |
| Householder who is White alone Map | 378 | 13,771 | 1,691,212 | 63,446,275 |
| Householder who is Black or African American alone Map | 602 | 32,392 | 534,727 | 6,261,464 |
| Householder who is American Indian and Alaska Native alone Map | 3 | 157 | 5,889 | 509,588 |
| Householder who is Asian alone Map | 72 | 2,790 | 61,567 | 2,688,861 |
| Householder who is Native Hawaiian and Other Pacific Islander alone Map | 0 | 17 | 899 | 61,911 |
| Householder who is Some Other Race alone Map | 91 | 1,824 | 34,688 | 1,975,817 |
| Householder who is Two or More Races Map | 15 | 779 | 25,420 | 1,042,158 |
| Renter occupied: Map | 1,063 | 38,903 | 1,231,182 | 40,730,218 |
| Householder who is White alone Map | 223 | 5,468 | 579,334 | 26,308,077 |
| Householder who is Black or African American alone Map | 651 | 29,438 | 529,984 | 7,868,519 |
| Householder who is American Indian and Alaska Native alone Map | 1 | 148 | 5,020 | 430,119 |
| Householder who is Asian alone Map | 21 | 625 | 34,219 | 1,943,303 |
| Householder who is Native Hawaiian and Other Pacific Islander alone Map | 0 | 22 | 1,062 | 82,021 |
| Householder who is Some Other Race alone Map | 152 | 2,337 | 56,544 | 2,940,610 |
| Householder who is Two or More Races Map | 15 | 865 | 25,019 | 1,157,569 |
| HOUSING UNITS, OCCUPIED, TENURE BY HISPANIC OR LATINO ORIGIN OF HOUSEHOLDER | ||||
| Owner occupied: Map | 1,161 | 51,730 | 2,354,402 | 75,986,074 |
| Not Hispanic or Latino householder Map | 1,005 | 47,947 | 2,262,073 | 69,617,625 |
| Hispanic or Latino householder Map | 156 | 3,783 | 92,329 | 6,368,449 |
| Renter occupied: Map | 1,063 | 38,903 | 1,231,182 | 40,730,218 |
| Not Hispanic or Latino householder Map | 821 | 34,482 | 1,115,777 | 33,637,301 |
| Hispanic or Latino householder Map | 242 | 4,421 | 115,405 | 7,092,917 |
| HOUSING UNITS, OCCUPIED, TENURE BY HOUSEHOLD SIZE | ||||
| Owner occupied: Map | 1,161 | 51,730 | 2,354,402 | 75,986,074 |
| 1-person household Map | 259 | 11,721 | 498,417 | 16,453,569 |
| 2-person household Map | 334 | 15,170 | 821,066 | 27,618,605 |
| 3-person household Map | 200 | 9,444 | 417,477 | 12,517,563 |
| 4-person household Map | 138 | 7,481 | 360,504 | 10,998,793 |
| 5-person household Map | 117 | 4,181 | 159,076 | 5,057,765 |
| 6-person household Map | 58 | 2,085 | 60,144 | 1,965,796 |
| 7-or-more-person household Map | 55 | 1,648 | 37,718 | 1,373,983 |
| Renter occupied: Map | 1,063 | 38,903 | 1,231,182 | 40,730,218 |
| 1-person household Map | 237 | 11,311 | 411,057 | 14,751,340 |
| 2-person household Map | 228 | 9,065 | 309,072 | 10,624,023 |
| 3-person household Map | 174 | 6,900 | 203,417 | 6,240,422 |
| 4-person household Map | 175 | 5,357 | 155,014 | 4,626,453 |
| 5-person household Map | 115 | 3,311 | 84,999 | 2,480,866 |
| 6-person household Map | 62 | 1,564 | 37,976 | 1,108,903 |
| 7-or-more-person household Map | 72 | 1,395 | 29,647 | 898,211 |
Loading...